New research from thrive at work suggests that the standard engagement survey most employers rely on captures only part of what determines whether work actually gets done — and for the majority of employees, it misses the more consequential half. The findings, drawn from a program covering 7,031 employees and 216,301 responses across Europe and North America, show that capacity — the energy, recovery, focus and resilience a person has available to keep performing — trails engagement almost everywhere it was measured.

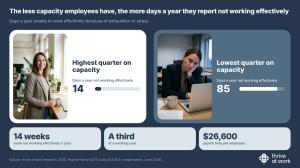
Days a year employees report not working effectively because of exhaustion or stress: 14 in the highest capacity quarter, 85 in the lowest. Source: thrive at work research, 2026.
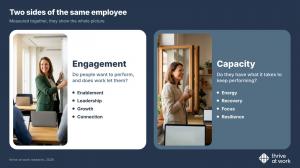
Engagement and capacity are two readings of the same employee. Source: thrive at work research, 2026.
Employees with the lowest capacity report 71 more days a year of not working effectively than those with the highest, new research finds
Employers have measured whether people want to do the work for decades. Whether they still have enough left to do it decides if good intentions become a finished week.”— Jerry Fišer, Founder, thrive at workSAN FRANCISCO, CA, UNITED STATES, November 2, 2026 /EINPresswire.com/ — More than 3 out of every 4 employees (76%) score lower on capacity than on engagement, according to the new research. The consequence is visible across the working year: the quarter of employees with the least capacity report 85 days a year of not working effectively because of exhaustion or stress, compared with 14 days for the quarter with the most. That works out to roughly 6 times as many days, or 17 working weeks against fewer than 3.
Capacity refers to the energy, recovery, focus and resilience a person has available to keep performing. An engagement survey does not capture it, which means a workforce can post strong engagement scores and still have less left to give.
The numbers that matter
• 3 out of every 4 employees (76%) score lower on capacity than on engagement, so an engagement score alone misses part of the picture for most of a workforce.
• 48.5 days a year is the average number of days employees say exhaustion or stress left them unable to work effectively. That is nearly 10 working weeks, about 1 in 5 working days (22% of a 220-day working year).
• 85 days against 14 separate the quarter with the least capacity from the quarter with the most: about 6 times as many days, or 39% of working days against 6%.
• A 71-day difference, about a third of a working year (71 of 220 working days). Under more conservative ways of converting the answers it is 52 to 65 days, roughly a quarter to a third.
• Ten percentage points more capacity goes with about 19 fewer such days a year, nearly 4 working weeks, with engagement held equal.
It shows up in the work
The gap carries through to output. Employees in the quarter with the most capacity say they delivered 86% of their priority tasks on time; in the quarter with the least, that figure falls to 56%, a difference of 30 percentage points. Loyalty splits along the same lines. In the top quarter of the thrive index, the combined score of capacity and engagement, 70% of employees would recommend their employer and 9% would not. In the bottom quarter, 16% would and 57% would not.
The gap is almost everywhere
Capacity sits below engagement in every one of 90 demographic segments examined and in all 18 industries.
Two sides of the same employee
Engagement shows whether people want to perform and whether work lets them: enablement, leadership, growth and connection. Capacity shows whether they have the energy, recovery, focus and resilience to keep performing. The two are different readings. Their scores overlap by only about a fifth, so about four fifths of each is information the other does not carry. They also do different jobs. Engagement has the stronger link with whether employees would recommend their employer. Capacity has the stronger link with lost working time: with engagement held equal, each capacity point goes with about 1.9 fewer days a year, about 3 times as many as an engagement point. Capacity is designed as a workforce performance measure, read alongside engagement.
“Employers have measured whether people want to do the work for decades. Whether they still have enough left to do it decides if good intentions become a finished week,” said Jerry Fišer, Founder of thrive at work. “An engagement score cannot answer that second question.”
Read the full Scientific Foundations White Paper: https://www.thriveatwork.ai/research/scientific-foundations
About the research
The findings are part of a research program covering 7,031 employees and 216,301 responses across Europe and North America; groups are compared at one point in time, and days not working effectively, answered by part of the sample, are as employees reported them. Capacity is measured with a behavior-anchored survey informed by biomarker and physiological research, without collecting biometric data. In a 12-month study, survey answers tracked resting heart rate and heart rate variability, and when a person's capacity changed, their heart rate variability changed with it.
About thrive at work
thrive at work is a workforce performance platform that measures employee capacity alongside engagement. Its research focuses on four dimensions of capacity: energy, recovery, focus and resilience, and how they relate to sustainable performance at work. Organizations use thrive at work to measure workforce capacity and engagement, identify performance constraints and translate insights into action plans and personalized learning.
Jerry Fišer
thrive at work
jerry@thriveatwork.ai
Visit us on social media:
LinkedIn
Instagram
Facebook
YouTube
X
Why it matters: The data suggests that even workforces scoring well on engagement may be running on empty, with the least-capacity quarter losing the equivalent of about a third of a working year to exhaustion and stress. For employers, that means engagement surveys alone may understate the performance risk sitting inside their organizations — and capacity, measured alongside engagement, offers a second reading of the same employee.