Log-hub has rolled out tailored map hierarchies and a stochastic mode within the Inventory Simulation App as part of its Log-hub 6.4 update.
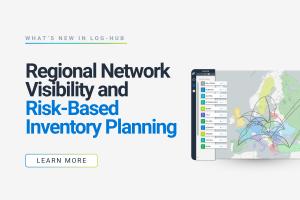
With this release, supply chain teams can now display their networks using their own geographic definitions and assess inventory strategies against a variety of demand forecasts, supporting more informed and data-driven choices.
Supply chains are frequently run by regions or different geographical divisions, yet network maps rarely depict them in the way they actually function. Inventory planning faces a comparable challenge, as demand fluctuates daily while inventory policies are typically established based on a single fixed forecast. In both situations, supply chain teams have to rebuild the analysis in spreadsheets before it can be used for management decisions, and Log-hub 6.4 aims to eliminate that step.
Through the new custom map hierarchies, organizations can establish their own regions and view their network in that exact structure—from individual sites up to country-to-country, region-to-region, or even continent-to-continent flows. The resulting view converts thousands of shipment connections into a clear network picture, ready for management reviews or board presentations. It emphasizes major transport corridors, regional dependencies, and chances to consolidate lanes or cut unnecessary movements between regions.
The newly introduced stochastic method in the Inventory Simulation App assists companies in making more informed inventory choices by simulating numerous demand scenarios and assessing various replenishment policies across every SKU and time period. By measuring the effect on service levels, lost sales, and costs, the app enables supply chain teams to pinpoint risks, weigh trade-offs, and set data-backed inventory targets. This allows teams to detect SKUs at risk of stockouts or excess inventory before issues arise, while providing executives with clear policy options and their associated trade-offs to support a structured, risk-based approach to working capital management.
Alexander Sigmund, CTO of Log-hub, stated: “Supply chain leaders are held accountable for cost, service, and working capital, and Log-hub 6.4 is designed to improve all three. Our customers can now see where their network is losing money and support their inventory targets with evidence, early enough to act before it shows up in the numbers.”
Additional updates in Log-hub 6.4 reduce manual work between data and decision in the same manner. In the Milkrun and Transport Optimization apps, multiple orders delivered to the same location now count as a single stop, so teams no longer need to merge orders or adjust stop limits as a workaround.
The Supply Chain Apps Agent can now generate interactive charts directly from app output tables and analyze datasets of more than 100,000 rows by working on the underlying data.
Log-hub 6.4 brings supply chain analysis closer to how organizations are structured and how demand behaves in practice. Updates such as these arrive every two months, and teams already using Log-hub’s Supply Chain Apps receive every new feature at no extra cost, so the tools they work with keep improving with each release.
To see the new features in action, watch the Log-hub 6.4 release webinar or test it yourself by getting our Fremium plan.
Jan Sigmund
Log-hub AG
email us here
Visit us on social media:
LinkedIn
YouTube
X
Beat US Tariff Changes: Building a Tariff Evaluation Engine